
Strategic measures
| Strategic measures | |||||
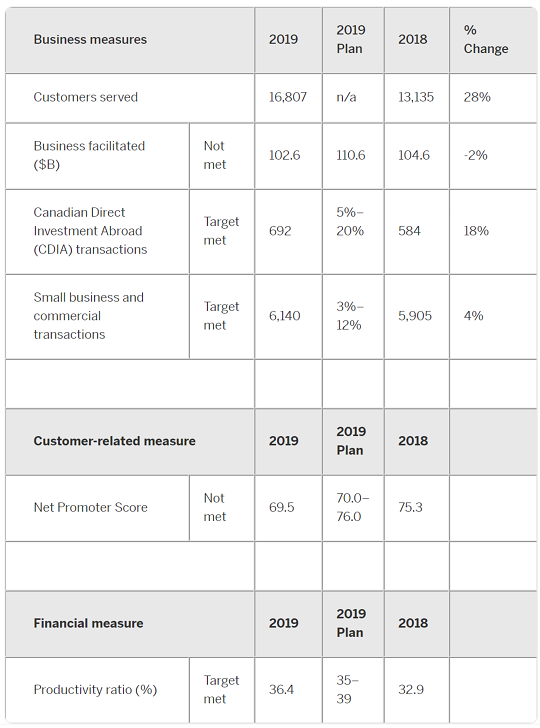
| Business measures | 2019 | 2019 Plan | 2018 | % Change | |
| Customers served | 16,807 | n/a | 13,135 | 28% | |
| Business facilitated ($B) | Not met | 102.6 | 110.6 | 104.6 | -2% |
| Canadian Direct Investment Abroad (CDIA) transactions | Target met | 692 | 5%–20% | 584 | 18% |
| Small business and commercial transactions | Target met | 6,140 | 3%–12% | 5,905 | 4% |
| Customer-related measure | 2019 | 2019 Plan | 2018 | ||
| Net Promoter Score | Not met | 69.5 | 70.0–76.0 | 75.3 | |
| Financial measure | 2019 | 2019 Plan | 2018 | ||
| Productivity ratio (%) | Target met | 36.4 | 35–39 | 32.9 | |

Business measures
Total business facilitated
$102.6 billion ↓ 2% vs. 2018
Through our range of financial solutions, we supported $102.6 billion in exports, foreign investment and trade development activities in 2019. Our insurance program helped more than 5,500 customers close over $75 billion in export sales, with almost 100,000 buyers located around the world. More than 76 per cent of this business was credit insurance, which helps companies mitigate credit risk and leverage their receivables with financial institutions to unlock more short-term financing. This insurance enables companies to conduct business in higher-risk markets than they would normally operate in. In addition, our financing activities delivered more than $27 billion in new financing to Canadian customers and their foreign trading partners.
Small business and commercial (SBC) transactions
6,140 ↑ 4% vs. 2018
Small and medium-sized enterprises (SMEs) are key contributors to economic growth, innovation and new job creation. They are also a key feature of Canada’s trade landscape. Accordingly, EDC places a strong emphasis on supporting SMEs in developed and emerging markets. We accomplish this through our financing and insurance solutions, as well as leveraging our relationships with foreign buyers to encourage the purchase of Canadian goods and services and introduce SMEs into their supply chains.
To track our efforts, we look at the number of insurance and financing transactions that occur with our SBC customers in a calendar year. This measure includes acquiring new customers, retaining existing customers and selling multiple products to customers. In 2019, we facilitated 6,140 transactions, up from 5,905 in the previous year. This growth is primarily due to a greater number of transactions with small businesses to help them gain access to financing.


Canadian Direct Investment Abroad transactions
692 ↑ 18% vs. 2018
Canadian Direct Investment Abroad is an important contributor to the Canadian economy. Canadian companies generate almost as many sales through their foreign affiliates as they do directly from their exporting operations. For many Canadian companies, establishing business operations or acquiring business assets in another country is a key strategy to achieve their business goals and stay competitive.
Supporting Canadian companies’ investments abroad is an integral part of our core business. We provide various solutions to assist Canadian companies with their foreign investment activities. These include loans to help companies open facilities in new markets or participate in joint ventures, or insurance products to mitigate overseas risks, such as a customer’s refusal to pay a foreign affiliate. We expanded the definition of CDIA in 2019 to include foreign branches and foreign assets.
In 2019, we facilitated 692 CDIA transactions, up from 584 last year. We witnessed increased growth with our working capital solutions, in particular our Export Guarantee Program (EGP) and International Trade Guarantees. These guarantees are offered in partnership with Canadian banks to support Canadian companies’ working capital needs, particularly Canadian SMEs.
Customers served
16,807 ↑ 28% vs. 2018
The customers served measure reflects EDC’s focus on helping more Canadian companies. This measure is the count of unique companies EDC transacts with over a calendar year. We consider a customer to be one that provides EDC with either financial payment or, in the case of certain knowledge-based products, information on their company that goes beyond publicly available information. EDC’s knowledge solutions serve the needs of many companies, particularly small-sized companies, who are looking for early-stage exporting information to help them make more informed business decisions.
In 2019, we served 16,807 customers, up from 13,135 in 2018. Just over 9,000 customers used one of EDC’s financial products, which was a five per cent increase over 2018. Included in these customers are more than 1,300 Canadian companies that used both financial and knowledge products. In addition to those 9,000 customers, we had another 7,800 Canadian companies that used at least one of EDC’s knowledge products, which was up 72 per cent compared to 2018.
Net Promoter Score
69.5 ↓ vs. 2018
The Net Promoter Score (NPS) is the measure against which EDC evaluates customer satisfaction and loyalty. It measures the likelihood that our customers would recommend EDC to business colleagues. As well, it provides insight on how we are meeting our customers’ needs and delivering on their expectations.
Our score of 69.5 places us in the top quartile of North American business-to-business companies according to industry benchmarks. However, it was lower than in 2018. The main drivers for this include: unclear communication to some of our larger customers with respect to EDC’s participation in their general corporate bank facilities; a large number of account management relationship changes for some customers; and usability issues as our insurance customers adopted the new online Portfolio Credit Insurance portal.
Productivity Ratio
36.4% Achieved target
The Productivity Ratio (PR), the ratio of administrative expenses to net revenue, captures how well we use our resources and ultimately how we manage our costs. In 2019, our PR was 36.4 per cent, which was within our target range of 35 to 39 per cent. This means that 36.4 cents of every dollar that we earn goes towards our expenses, with the remaining 63.6 cents available to grow our capital base and support our loan and insurance portfolios.
The PR in 2019 was less favourable than the 2018 PR of 32.9 per cent, but this was an expected consequence of EDC’s ongoing broader transformation. For example, serving more small and micro-sized businesses is a top priority, but these companies generate less revenue for EDC than larger companies, and serving a growing number of them requires more resources. We are also investing significant resources in strengthening our Corporate Sustainability and Responsibility (CSR) and risk management practices – both of which are critically important for EDC’s long-term sustainability, but do not generate revenue. These investments mean we are running a more expensive business now, but all with a view to building a stronger foundation and improving our position to deliver for Canadian businesses going forward.
| CSR measures | ||
| 2018 | 2019 | |
| Environment and people |
||
| Clean technology business facilitated | $2.1 billion | $2.5 billion |
| Number of clean technology financial customers | 210 | 227 |
| Business integrity | ||
| Number of financial crimes awareness-raising sessions delivered to EDC customers | 2 | 4 |
| Percentage of new customers receiving letter from EDC CEO advising them of Canada’s anti-corruption laws and bribery and corruption risk reduction information | 100% | 100% |
| Percentage of relevant employees receiving financial crimes training (annual) | 100% | 100% |
| Percentage of employees certified on EDC’s Code of Conduct (annual) | 100% | 100% |
| Our workplace | ||
| Percentage of leadership roles held by women | 47% | 52% |
| Percentage of indigenous people | 1.4% | 1.2% |
| Percentage of persons with disabilities | 2.8% | 2.5% |
| Percentage of visible minorities overall | 19.2% | 20.5% |
| Percentage of new employees who received sustainable and responsible business onboarding | 62% | 80% |
| Percentage of new Board members who received sustainable and responsible business onboarding | 100% | n/a |
| Carbon footprint (tonnes CO2e) | 3,330 | 3,539 |
| Number of initiatives supported by the EDC-CARE Partnership (including advisor placements, project proposal support, memberships, conference/forum participation) | 25 | 14 |
| Our communities | ||
| Number of EDC-sponsored employee volunteer days | 80.5 |
62.5 |
| Number of students supported | 1,174 |
1,804 |
| Number of women-owned businesses served with knowledge, connections and financial solutions | 144 | 333 |
| Women-owned and women-led business facilitated | $400 million | $650 million |
| Women-owned and women-led unique customers acquired | 119 | 132 |
| Women-owned and women-led unique customers served (cumulatively) | 249 | 381 |
| Number of small business customers served | 8,801 | 11,925 |