EDC Economics looks back at an eventful year and the road ahead for 2020


Global goods trade contracting
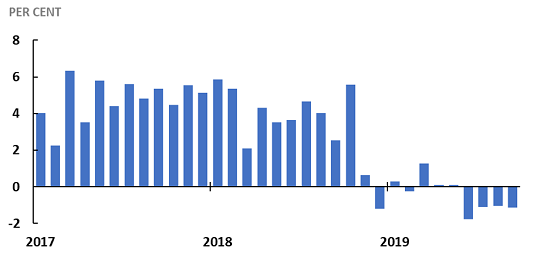
Source: CPB Netherlands
Canada’s agriculture exports caught in the crossfire
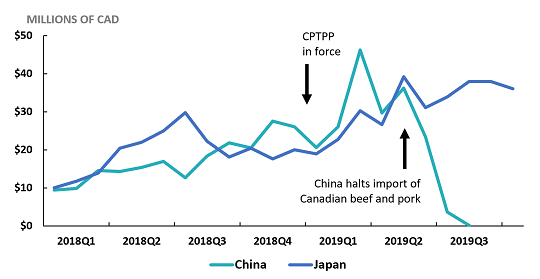
Source: Trade Data Online
Uncertainty about the World Trade Organization’s dispute settlement system
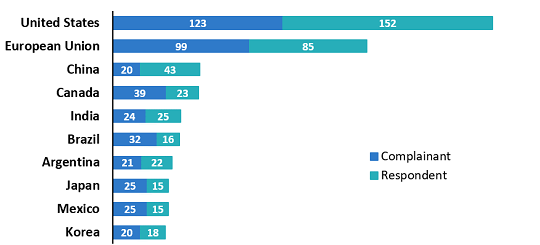
Source: Peterson Institute for International Economics, WTO trade monitoring database
Global protests and social unrest
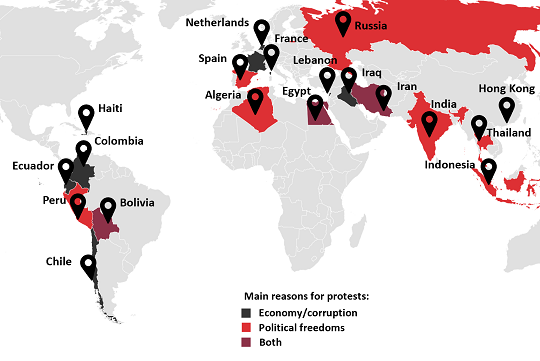
Source: GZERO media, EDC Economics
Brexit
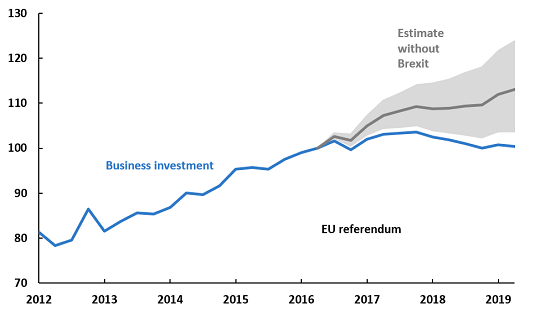
Source: Bank of England, Monetary Policy Report, November 2019
American oil dominance
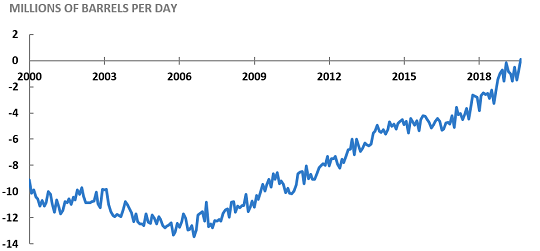
Source: Energy Information Administration (EIA)
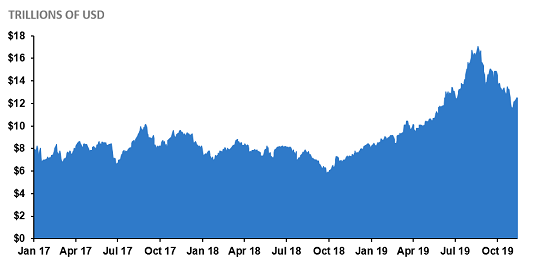
Recession worries
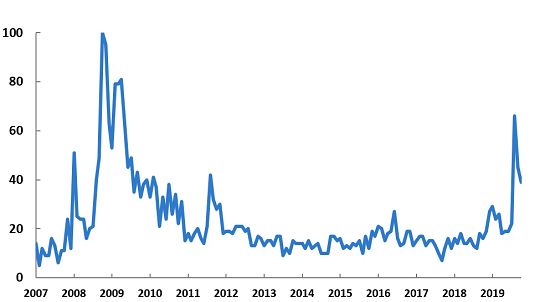
Source: Google Trends
Emerging Asia slowdown
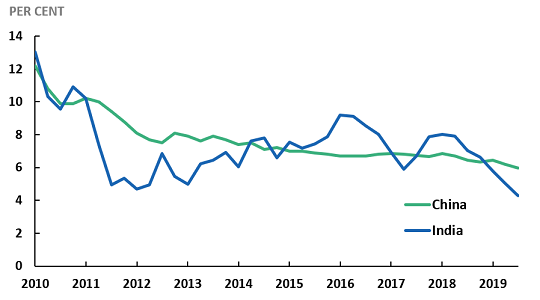
Source: Haver Analytics, EDC Economics
Widespread central bank interest rate cuts
Source: Bloomberg, EDC Economics
Canadian yield curve inversion
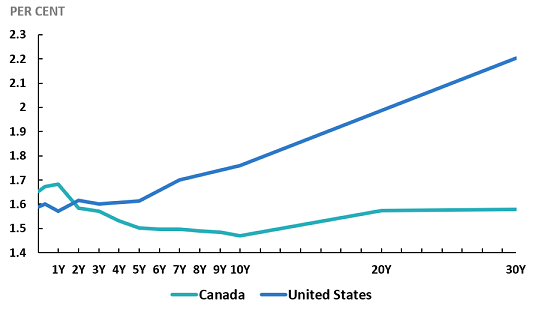
Source: Bloomberg, EDC Economics