
Canada-U.S. trade still a driver for automotive sector

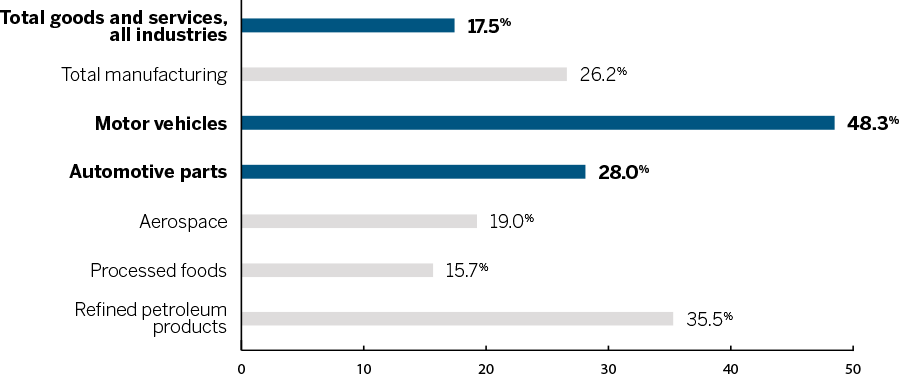
And it’s the same for Canadian automotive components shipped to the U.S., which have an average of 28% American content.
U.S. Content in Canadian Exports to the U.S. (%)
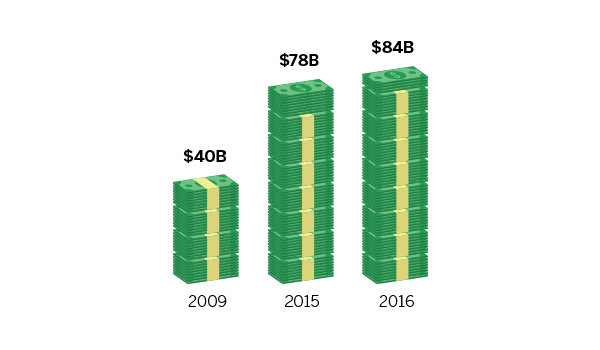
U.S. Trade in Automotive Parts

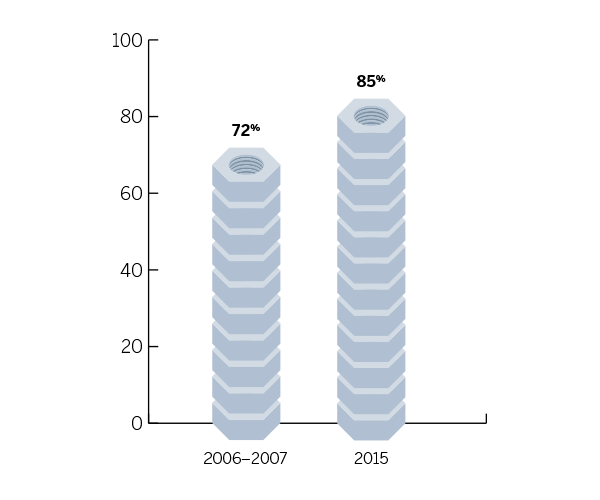
Fasten your seatbelts for revved-up demand
On top of that, Americans have tended to put off buying new cars due to the long recession. The average automobile in the U.S. is currently 11 years old, so buyers can’t hold out much longer. This means demand for new cars is expected to remain steady or grow over the next several years at least.

Then there’s the Millennials, and their impending impact on the economy. Almost a third of U.S. young adults are still living at home, roughly 25 million people. But as the American economy shifts into higher gear, bringing more jobs and higher incomes, they may start moving out of their parents’ basement– and spending money that will boost the economy and further inflate demand for vehicle sales.
Capacity utilization means how much of the productive capacity of a plant, firm, or country is being used to generate goods and services. The U.S. automakers are already putting the pedal to the metal, topping 85% of capacity utilization in December 2016, which is nearly an all-time high. That means that meeting the increased demand will be an uphill battle for them without their Canadian counterparts. Canadian auto sales to the U.S. reached $84 billion in 2016, the highest sales since 2002.

Steering in the right direction with diversified supply chains
Firms have spent years developing finely honed logistics and inventory management that will take years to replace.
Solely U.S.-based production would increase costs, making the U.S. autos less competitive and upsetting customers and shareholders, while making competitors ecstatic.
In the U.S., some 637,000 direct and indirect jobs are supported through trade in the automotive sector.

Sales may hit the brakes if an import tax is implemented
Many buyers already are stretched to the limit, as dealers increasingly rely on seven-year and sometimes even eight-year loans to help…