U.S. wealth effect: How rising asset prices are driving consumer spending
What’s driving the U.S. wealth effect?
How higher household wealth drives consumer spending
Loading
MyEDC account
Manage your finance and insurance services. Get access to export tools and expert insights.
Solutions
By product
By product
By product
By product
Insurance
Get short-term coverage for occasional exports
Maintain ongoing coverage for active exporters
See how portfolio credit insurance helped this Canadian innovator expand.
Guarantees
Increase borrowing power for exports
Free up cash tied to contracts
Protect profits from exchange risk
Unlock more working capital
Find out how access to working capital fueled their expansion.
Loans
Secure a loan for global expansion
Get financing for international customers
Access funding for capital-intensive projects
Find out how direct lending helped this snack brand go global.
Investments
Get equity capital for strategic growth
By industry
Find opportunities in agri-food trade
Expand your cleantech business
Grow your defence exports
Expand your digital exports
Explore solutions for domestic oil and gas
Scale your mining and minerals exports
Resources
Popular topics
Explore strategies to enter new markets
Understand trade tariffs and how to manage their impact
Learn ways to protect your business from uncertainty
Build stronger supply chains for reliable operation
Access tools and insights for agri-food exporters
Find market intelligence for mining and metals exporters
Get insights to drive sustainable innovation
Explore resources for infrastructure growth
Export stage
Discover practical tools for first-time exporters
Unlock strategies to manage risk and boost growth
Leverage insights and connections to scale worldwide
Learn how pricing strategies help you enter new markets, manage risk and attract customers.
Get expert insights and the latest economic trends to help guide your export strategy.
Trade intelligence
Track trade trends in Asia-Pacific
Uncover European market opportunities
Access insights on U.S. trade
Browse countries and markets
Get expert analysis on markets and trends
Discover stories shaping global trade
See what’s ahead for the world economy
Monitor shifting global market risks
Read exporters’ perspectives on global trade
Knowledge centre
Get answers to your export questions
Research foreign companies before doing business
Find trusted service providers
Gain export skills with online courses
Discover resources for smarter exporting
Get insights and practical advice from leading experts
Listen to global trade stories
Learn how exporters are thriving worldwide
Explore export challenges and EDC solutions
About
Discover our story
See how we help exporters
Explore the companies we serve
Learn about our commitment to ESG
Understand our governance framework
See the results of our commitments
MyEDC account
Manage your finance and insurance services. Get access to export tools and expert insights.
Senior Economist, Economic and Political Intelligence Centre (EPIC)
In this article:
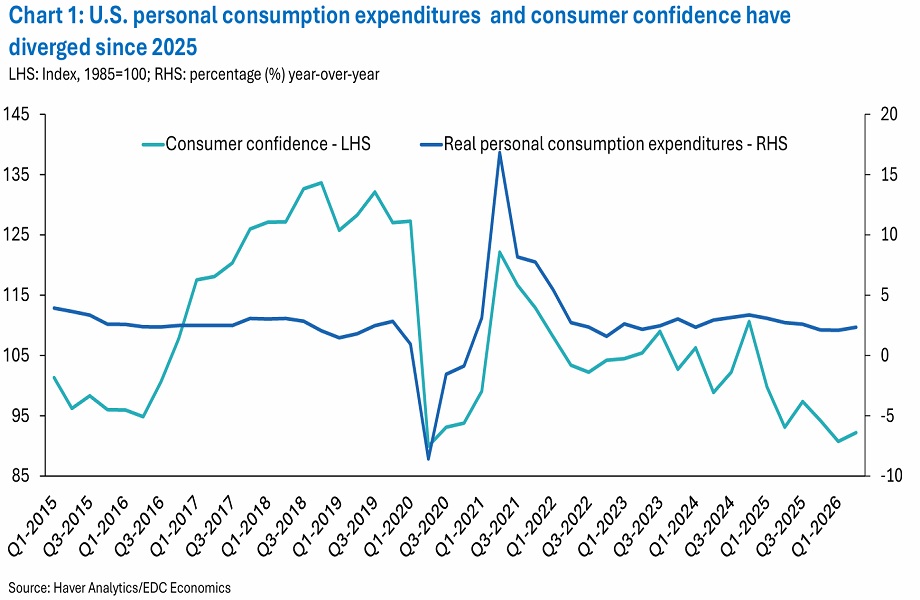
For two decades before the pandemic, U.S. consumer spending and household disposable income moved in lockstep, each growing by about 2% a year. The COVID-19 pandemic broke that pattern.
While real, inflation-adjusted consumer spending in the U.S. increased annually by about 4% between 2021 and 2025, real disposable income grew by only 1.6% per year over the same period. Because private consumption accounts for roughly 70% of the U.S. economy, this disconnect has potentially significant implications for consumer debt, sentiment and overall economic growth.
The latest data show little sign of normalization: Real consumer spending outpaced real disposable income by a full percentage point in 2025 and the gap continues to widen in 2026. As Export Development Canada’s (EDC) North American economic outlook notes, resilient consumer demand continues to support U.S. economic growth.
This gap matters because consumer spending increasingly depends not only on labour income, or regular take-home pay, but also on rising asset values that make households feel wealthier. This is known as the wealth effect.
When home prices or investment values rise, consumers feel wealthier and spend more. But those gains can disappear quickly and, if that happens, spending may decline. At a time of weak consumer confidence and modest disposable-income growth, this dependence creates economic risk and adds affordability pressures for U.S. consumers.
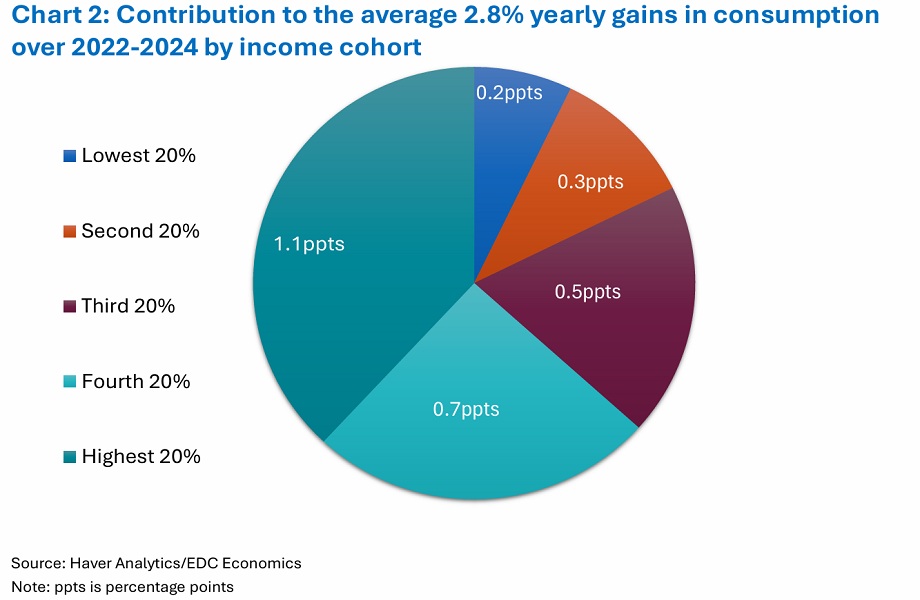
The wealth effect isn’t distributed evenly across U.S. households or the economy. To benefit from rising asset prices, consumers generally need to have acquired those assets before prices increased. This helps explain a growing divide in U.S. consumption. Of the 2.8% growth in real consumer spending between 2022 and 2024, 2.3 percentage points came from higher-income consumers, while households in the bottom 40% of the income distribution accounted for just 0.5 percentage points.
The reason for the divide is clear: Higher-income households have benefited from gains in financial assets and home equity, while many lower- and middle-income households have faced greater pressure from higher prices, borrowing costs and labour market uncertainty.
As long as their assets continue to appreciate—or hold their value—higher-income households are likely to keep spending. Their wealth gives them room to spend on non-essential items, supporting overall consumption even when consumer confidence is weak and financially stretched households are cutting back or becoming more selective.
Global growth continues despite energy shocks, trade pressures and higher borrowing costs. See EDC’s latest forecasts and what they mean for Canadian exporters.
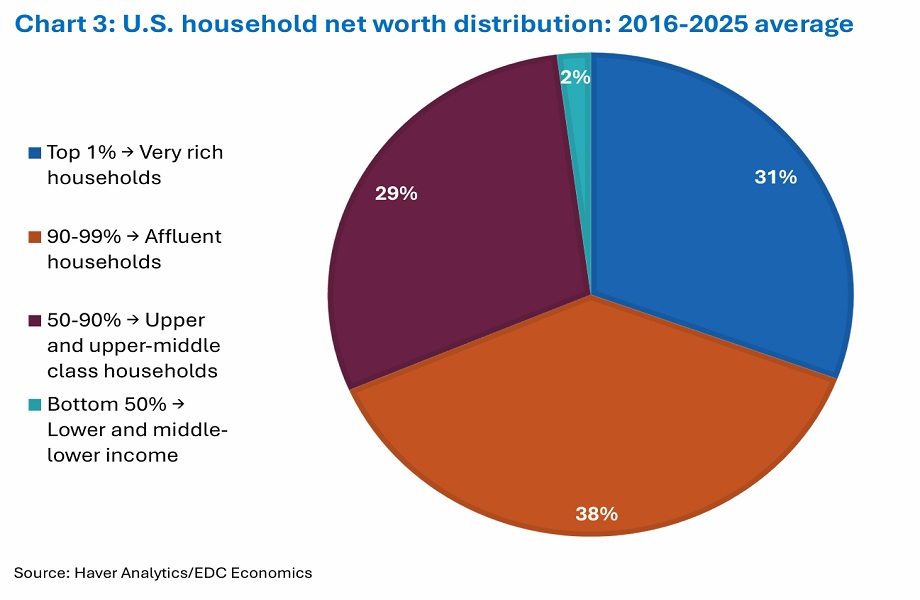
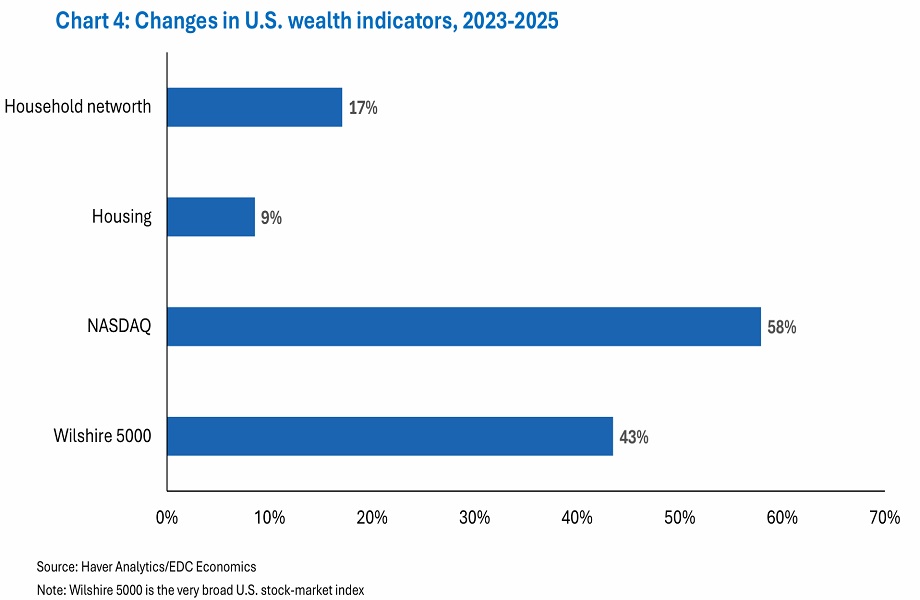
Although overall U.S. household net worth has risen steadily over the past 25 years, growth has accelerated recently, increasing by more than 8% annually over the last three years—roughly 25% on a cumulative basis. These gains have been driven largely by financial assets, including stocks and bonds with strong capital gains (+14%) and dividend growth (+11%). Home-equity gains have been more modest (+5%).
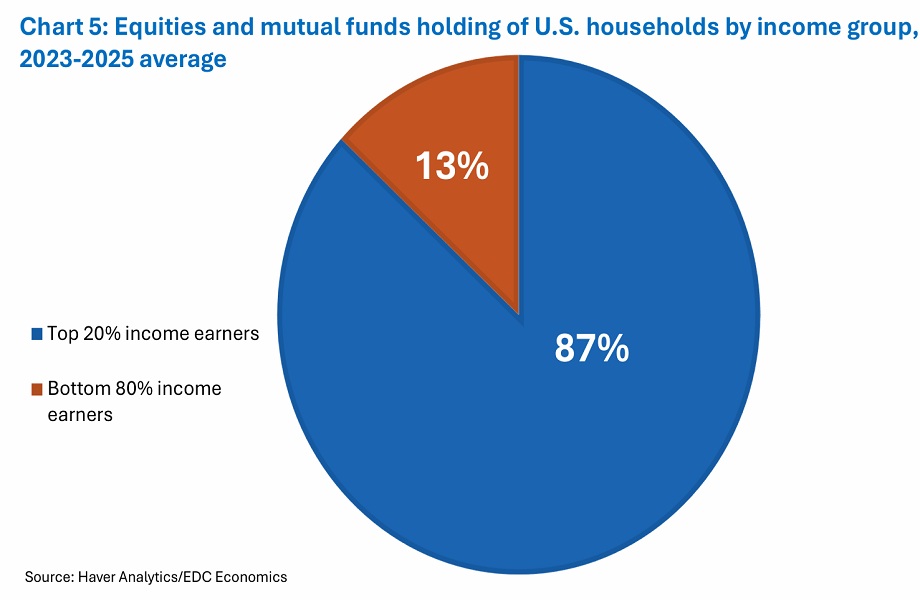
For wealthier Americans with equity investments, strong market gains have created more room for discretionary spending. For example, between 2023 and 2025, the Wilshire 5000, a broad-based U.S. equity index, rose 43%, while the technology-heavy Nasdaq increased by about 58%. These gains were largely concentrated: The top 20% of U.S. income earners hold about 87% of equities and mutual funds, leaving lower-income households and those unable to accumulate and hold assets fewer gains.
Because equities and other marketable assets are central to the current wealth effect, this support is highly exposed to financial market volatility and corrections.
When the price of assets rises—whether stocks, housing, pensions or crypto assets—household wealth increases and households perceive their balance sheets as stronger. Greater confidence in their financial well-being can reduce precautionary saving and encourage more discretionary spending.
If asset-price growth persists, households may reset their expectations and begin to view higher valuations as permanent. This can lead to more spending. Liquid assets such as equities and mutual funds can be readily sold to support spending, while less-liquid assets, like a home or vehicle, can increase the collateral available for borrowing.
Households generally spend only a portion of their wealth gains. The effect also depends on which households receive the gains.
Please watch your inbox for our email.
Loading
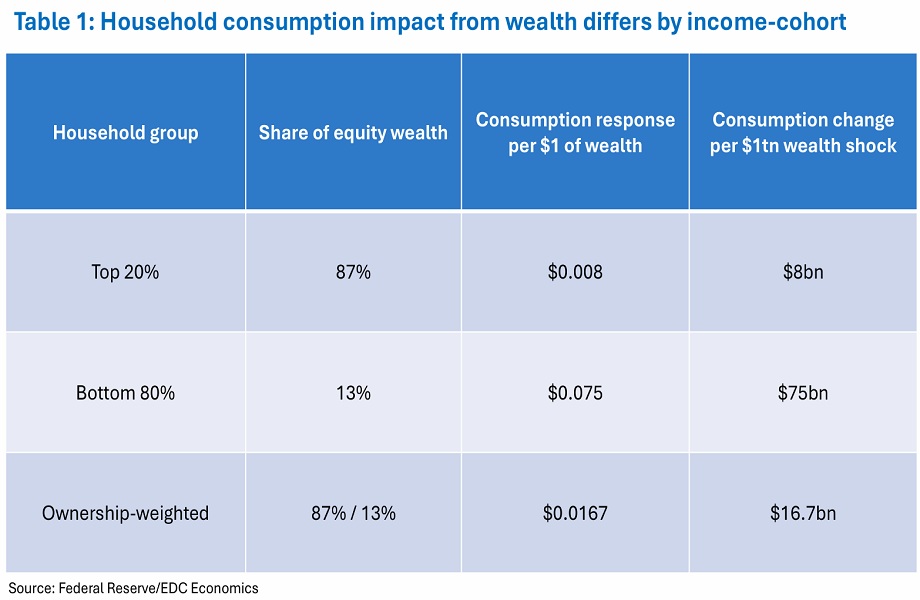
Lower-income households tend to spend a larger proportion of income gains on current needs than more affluent households. The U.S. Federal Reserve estimates that the top 20% of income earners spend about 0.8 cents of each additional dollar of wealth, compared with about 7.5 cents for the bottom 80%.
Combining asset ownership with the Fed’s estimates of how much households spend produces an average of 1.67 cents in economy-wide spending for every additional dollar of wealth. Because affluent households hold a large share of net worth, the overall effect of higher wealth on consumption is moderate, as shown in Table 1.
The ownership-weighted example in Table 1 shows why a large stock market move may have a smaller consumption effect than a similar wealth gain distributed broadly.
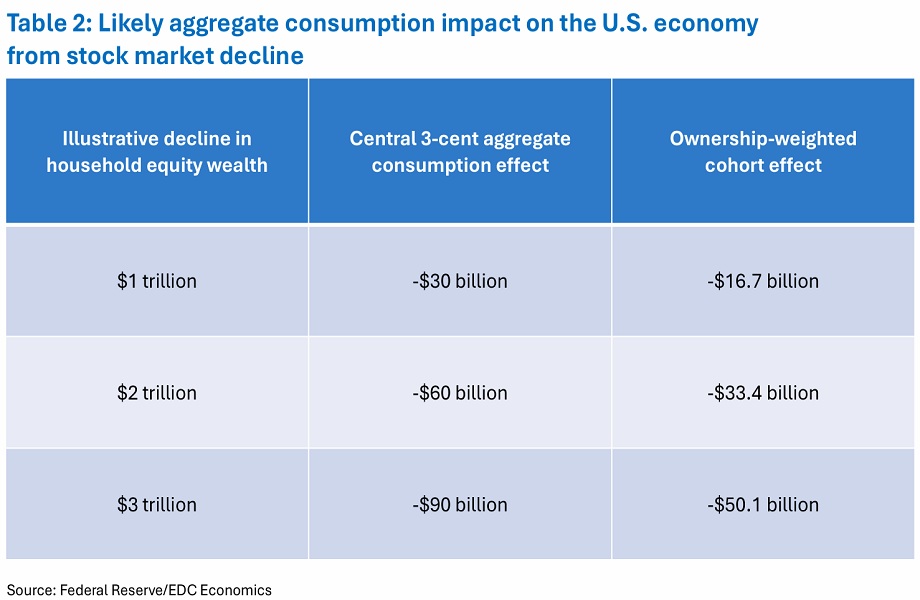
If a $1-trillion equity loss were allocated according to current ownership shares, the implied reduction in consumption would be about $16.7 billion: approximately $7 billion from the top 20% and $9.8 billion from the bottom 80%. The latter group owns less equity, but has a much larger spending response per dollar of wealth.
External estimates suggest that each additional dollar of net worth raises consumption by three to five cents. Oxford Economics estimates an increase of about five cents, while Moody’s estimates three cents. EDC Economics finds a similar relationship: A $1 increase in net worth is associated with roughly three cents of additional consumption.
These estimates broadly align with U.S. Federal Reserve estimates, which suggest that a $1 increase in net worth is associated with a 2.7- to 3.5-cent increase in consumption. At the macroeconomic level, Moody’s estimates that the wealth effect has contributed roughly 0.35 percentage points per year to U.S. real gross domestic product (GDP) growth over the past four years.
Understand landed costs, identify hidden expenses and explore duty recovery opportunities
If three cents of every dollar of wealth gained or lost translates into a change in spending across the economy, Table 2 illustrates the potential aggregate consumption impact on the U.S. economy.
For example, if a stock market decline reduces household equity wealth by $2 trillion—about 3% of total U.S. household equity holdings—the central aggregate estimate would imply roughly $60 billion less consumption. The cohort-weighted calculation would imply a reduction of about $33.4 billion. The difference provides a useful indication of model uncertainty and highlights the importance of identifying which households bear the loss.
The extent to which wealth lifts consumption depends not only on how the wealth is distributed, but also on its source, such as stocks or housing. Housing wealth is less liquid than equities. Homeowners generally need to sell, refinance or borrow through a home-equity line of credit to turn appreciation into cash. Many older and wealthier homeowners have ready access to credit and remain locked into low mortgage rates. In a higher-rate environment, refinancing or drawing on a home-equity line is less attractive than it was before the global financial crisis. This limits the near-term spending response to higher home values.
Rising household wealth has been an important tailwind to U.S. consumption, but the support is narrower and more fragile than the headline spending data suggest. Equity gains have been the main driver, ownership is concentrated and affluent households spend a relatively small portion of each additional dollar of wealth gain. A market correction would reverse this support and represents a material downside risk for U.S. demand and Canadian exporters.
Consumer demand is only one factor shaping the outlook for Canadian companies selling into the U.S. EDC’s One year later: How U.S. tariffs reshaped Canada-U.S. trade examines how tariffs and trade uncertainty are affecting Canadian exporters and what businesses should watch next.
For a broader look at the U.S. business environment, explore EDC’s U.S. market intelligence hub for insights and analysis to help you navigate market conditions and identify opportunities.
Senior Economist, Economic and Political Intelligence Centre (EPIC)
Prince Owusu - LinkedIn
Insights and analysis from EDC on navigating the U.S. business environment
Keep track of the international markets that matter to your business. Get the latest financial and macroeconomic information for both developed and emerging markets.
EDC’s latest Trade Confidence Index shows how exporters are adapting to volatility